Start

We all need to eat to live, but how many of us live to eat?

"Overweight and obesity are defined as abnormal or excessive fat accumulation that may impair health."
      - World Health Organization (WHO)

A Body Mass Index (BMI) over 25 is defined as overweight and a BMI over 30 is defined as obese. In 2016, 39% of adults worldwide were overweight and 13% were obese. WHO considers obesity an epidemic and calculated in 2017 that 2.8 million people die every year due to being overweight or obese. Obesity is also considered an easily preventable epidemic by the WHO, as it in most cases can be prevented by having a healthy diet and doing physical exercise.

In this analysis, packaged food products from two countries will by analysed by investigating their nutritional information. Can one observe a relation between the nutrients in a country’s food and their current health status according the health indices given by the WHO? That is what we’re going to see today.
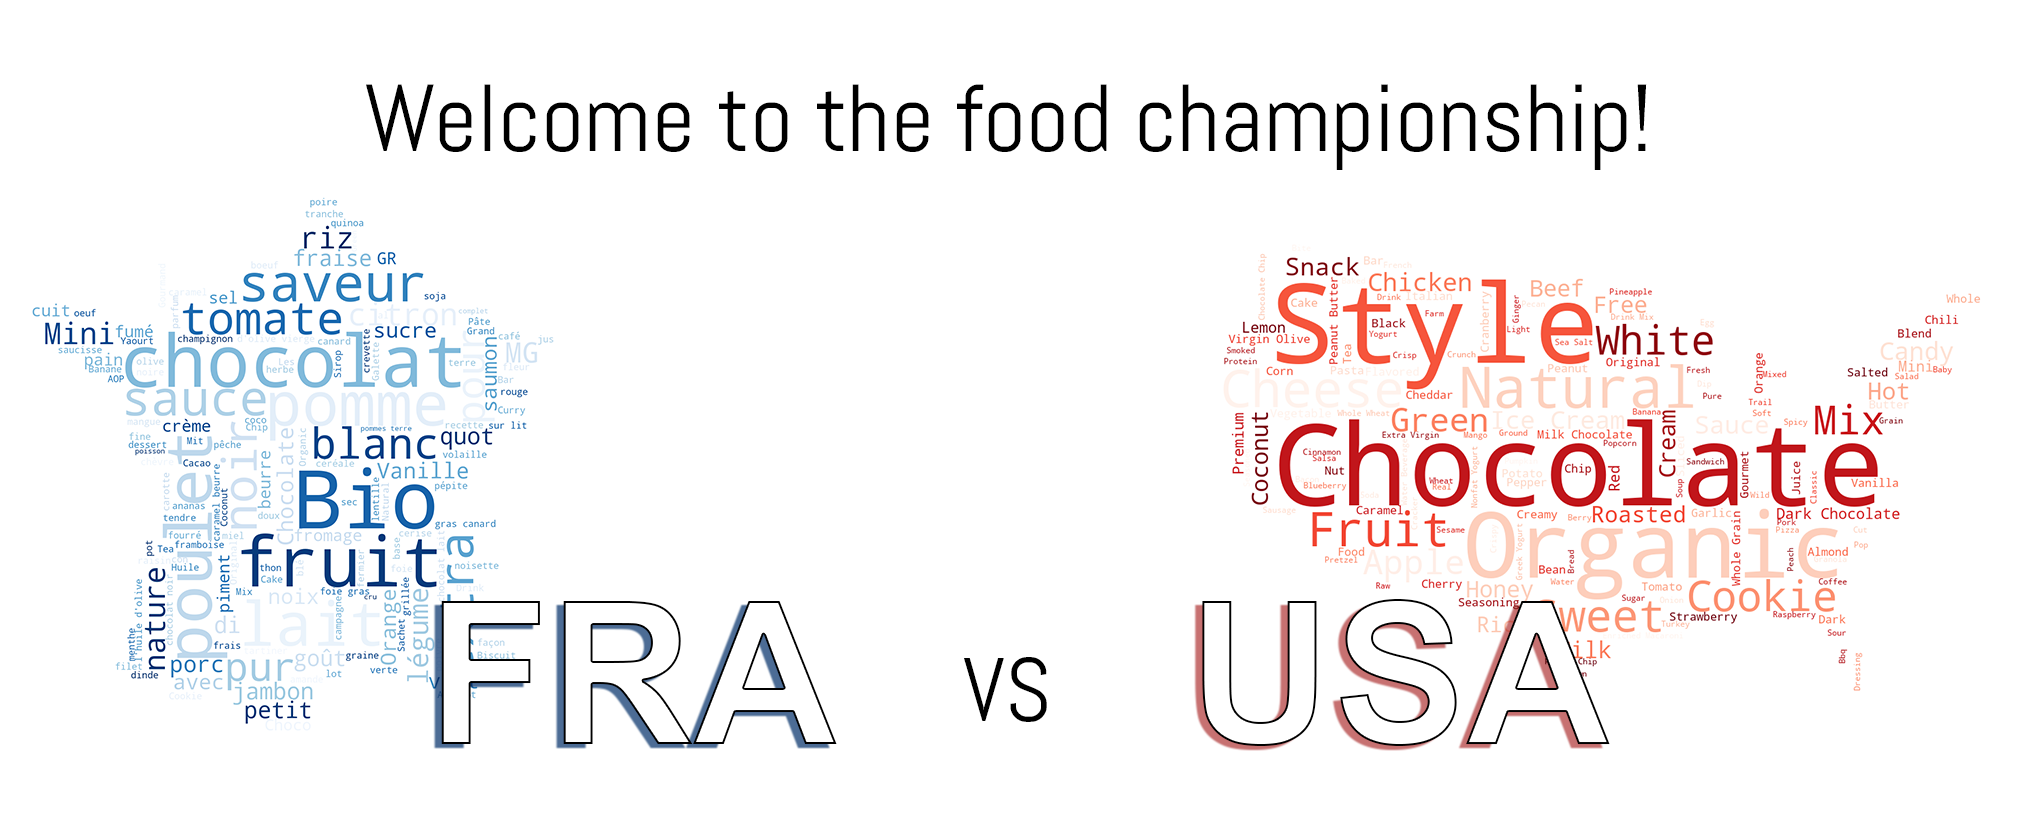
Our Contestants

Our first contestant brought us the Eiffel Tower and the riviera. With an average BMI of 25.6, one of the best in Europe, France can be considered the favourite of this competition, but can it stand the pressure?

With noted overweight among 67,9% of the population and an average BMI of 29,1 our second contestant is the big burger-loving country on the other side of the Atlantic Ocean, United States of America.

Statistic France USA
Overweight among adults 59.5% 67.9%
Obesity among adults 23.2% 37.3%
Overweight among children and adolescents 5-19 years 28.9% 41.2%
Obesity among children and adolescents 5-19 years 8.1% 21.4%
Mean Body Mass Index adults 25.6 29.1
Mean Body Mass Index 5-19 years 19.5 21.5
Blood glucose ≥126 mg/dl (7.0 mmol/l) 5.9% 7.3%

Table 1: Health statistics of France and United states

Data

The dataset used to investigate the nutritional ingredients in the products was the Open Food Facts Database. The database is a non-profit open database, which means that anyone all over the world can use the data and contribute to the database. Within the database, 459 371 products were labelled with France and 175 661 products labelled with the US. The data was extracted with respect to the labels into two subsets. Since the French data set was significantly larger, it was randomly downsampled to consist of the same amount of entries as the US dataset.

During the analysis, features regarding nutriments, such as energy per 100g and sugars per 100g, as well as product names and food categories were investigated. Names and food categories were used to categorize the data to compare nutritional values between the two countries with products in the same category. This was to make sure the comparisons would make sense: comparing the sugar content of a lollipop from the US with the sugar content of a soup from France would not give a true image of the data.

While the open nature of the database generates a lot of data, the contributions are, as of yet, not automatically checked. This generates a lot of missing values in the dataset, as well as errors and inconsistencies. To give both our contestants the best and equal opportunities the data was therefore cleaned as follows:

The last point was important because no nutriment can be more than a 100% of a product. Since each nutriment is defined per 100g, we set that the range should be between 0 and a 100. The only nutriment feature we did not do this for was energy_100g, as energy when given in Kj can be more than 100 per 100g.

Food categories

This competition will consist of 5 rounds that each investigates one food category. The five categories are:

Some of these categories are divided in to subcategories as well, for example the category Snacks is divided in to the subcategories Sugary snacks and Salty snacks. For each category, we have chosen different nutriments to focus on, such as sugars per 100g for Sugary snacks.

The products were sorted into the categories by their label, product name and ingredient list. Let's look at the category Fats as an example. First, words were defined that are associated with fats, such as butter and oil. Both English and French words were used to make sure that as many matches as possible were found. Then, both datasets were queried to see the results of the filtering. If the results contained unwanted products, a list of words that were not part of the category was defined. This list was then used to filter away the wrongly classified data. As an example, “butter popcorn” was initially sorted to the fats category since it contains the word “butter”. However, “butter popcorn” is not a type of a fat and should not be part of the fats category. Therefore the word “popcorn” was added to the “not a fat word” list.

But enough with details, let’s start the competition. May the best food country win!

Fats

We start off this competition by studying the countries’ fats. This category contains products that can be considered as pure fats. This includes oil, butter, nut butter and different kinds of margarines. The distribution for these subcategories can be seen in the following plot.

Please hover over each plot to investigate them yourself!

The distribution plot shows that France has more different types of oil and butter while the US stands out with a considerably higher percentage of peanut butter. As a side-note we can also see that over half of the oils in France are olive oil, while olive oil only corresponds to less than a fourth of the oils in the US.

When studying fat it is really the relation between saturated fat and unsaturated fat that are interesting. Studies have shown that unsaturated fats have a positive effect on health issues and reduces the blood cholesterol levels, but they also suggest that saturated fat have the opposite effect. In the following plots we therefore further investigate these fats.

Here we clearly see that France has a higher amount of saturated fat, while the US has a higher amount of both monounsaturated fat and polyunsaturated fat. Maybe the higher amount of nut butter and still a high amount of oil helps the US get these good values. Anyway, this gives US the first point of this competition!

Meat Poultry Fish

In this round we will take a closer look on the meat, poultry and fish products. While the raw meats will probably not differ that much in nutriments, the reasoning behind this category is that the countries might have products with meats but also additional ingredients, for example ready to eat meals or a meat product marinated in some kind of sauce.

Let's start off by looking at the differences for different nutriments.

The plot for carbohydrates shows that products from the US seems to contain much more per 100g than the products from France. This observation could, as mentioned in the introduction of this category, be explained by that the different countries prepare the food differently. A common prejudice is that products from the US are often fried in oil, have a larger amount of sauces, have more marinated items or more items that comes wrapped in bread. Maybe this observation could support that theory? Let’s dig deeper and look at the amount of fat per 100g. Here we can see that the values for the US are actually lower than for France, which contradicts the hypothesis.

Interesting side-note: In our data analysis we took a closer look at the France data, and found out that 76.84% of the meat items from France that have between 50g and 80g of fat per 100g are Foie Gras. This is a common product in France with a quite high fat level. This might help explain the possibly surprising difference in amount of fats in meat between the two countries.

Lastly, the amount of sugar is considerably higher in the US than in France. This is no surprise given the results of the carbohydrates since the two are often correlated.

It’s time to wrap up this round. To conclude this category, the amount of calories in this category is about the same for the both countries. However, there is a rather clear difference in where the energy is stored. For the US products the energy is stored in carbohydrates and sugar. For products from France the energy is stored in the fat. To decide which one is the “most healthy” here is a bit controversial, as the healthiness of fat is not well defined. In general, eating large amounts of sugar and carbohydrates have been shown to have a worse influence on the common health than fats. For this reason, this round goes to France.

Dairy

So far the competition is still open, we won’t stop here, let’s continue with the dairy products.

This category consists of for example yoghurt, milk or cheese. To get a feeling for the different kinds of subcategories, we take a look at their distribution. Since we already covered the fats, butter has been removed from this category.

The distribution of the products within dairy shows that a large portion of the dairy items in both the US and France are cheese-related items. For an interesting side-note, hover over the cheese bar. The distribution also shows that the US has almost double the amount of ice cream compared to France, and that France has almost double the amount of milk compared to the US.

We now take a look at the nutrients. Firstly, one radar plot for sugar, carbohydrates, proteins, fat and the different types of fat, e.g. saturated, monounsaturated or polyunsaturated fat. Secondly, one regular bar plot for sodium and calcium. In the radar plot, the values are given in grams and are of equal size, while in the plot for sodium and calcium, the values are given as a fraction of the recommended daily intake.

Even though the US have both more unsaturated fat and proteins in their dairy food it still doesn’t compensate for the fact that their food also contains twice as much saturated fat, sugar and carbohydrates. The food from France has a lower amount of sodium and more calcium. These are all reasons why this round goes to France.

Bread

Now it is time for round 4!
In this category we compare the breads between the two countries. This does not include cookies, biscuits and sugary snacks made from grains. The first discovery made was that there is a higher number of bread-related items in the US compared to France, 5404 compared to 3107. Maybe the local bakeries in France is the reason for this? In France it is common to go and buy fresh bread in a bakery instead of going to the supermarket. This could be the reason for the lower amount of packaged bread in France.

When comparing the bread products, it can be seen that the energy values are very similar. However, when it comes to carbohydrates, the bread from the US definitely contains more. Nevertheless, the French bread is not all perfect. In fact, the bread items from US have less sugar per 100g than bread from France. This is unexpected, since carbohydrates and sugars often correlate. An explanation could be that France has more light bread with more white sugar than the US, so that the carbohydrates in the US bread comes from the grains rather than the sugar. This hypothesis is strengthened when looking at the fiber per 100g, where the US has more (note that this plot is logarithmic).

The difference in the amount of fat between the two countries is not very big, with France having just a little bit more in general. A guess of what could be causing this is that the bread in France in general have more butter and oil on it.

Based on the stated observations, we conclude that the US has darker bread with less butter and oil on it compared to the bread from France. Both more darkness as well as less butter/oil are things that we consider as good things, which is the reason the US wins this round.

Snacks

Time for the final round! Since this is a large and rather diverse category it has been divided in to two subcategories, Sugary snacks and Salty snacks. The total amount of French snack products was 22 364 while the US had 31 544 products which is a considerable larger number.

Sugary snacks

Let's start with the sugary snacks. In the graph the distribution of the subcategories in Sugary snacks is shown. The four subcategories are: chocolates, bars, candy and cookies.

Both of our contestants have a quite equal distribution within the sugary snacks, US have a bit more bars while France have more cookies. Once again let’s have a look at the nutrients. Interesting here is the sugar, carbohydrates and energy as in calories but also the serving quantity. With the serving quantity it is possible to see how big the portion sizes actually are.

An initial observation is that neither sugar nor carbohydrates differ a lot between the countries, even though the US skews a little bit higher. The US does however have a larger serving quantity than France does, but France has more items with higher energy values as can be seen by comparing the two histograms for energy. It's hard to determine between the two what is worse for health. A larger serving quantity indicates that people eat more, but higher energy values can also make someone unaware of the amount of calories consumed.

Salty snacks

Now we continue with the salty snacks.

The nutriments used to compare the countries for the salty snacks is sodium, fats, saturated fat, carbohydrates and energy.

Sodium seems to be the same amount in products from both countries. In France, the level of fats differ more than in the US but the higher quantile is close to the same level as well. The US has higher levels of saturated fats than France does, which are considered the bad fats. Carbohydrates per 100g also have higher values in the US products than in the ones from France. The serving quantity plot only shows that the data has a lot of outliers, and cannot be considered to show any significant differences between the countries. France has, once again, higher energy levels than the US does.

From the data, we conclude that France has healthier nutriments than the US does. Even though they were alike in a lot of subcategories, there were still some notable differences. The serving quantity is smaller for sugary snacks in France as well as the fact that the salty snacks from the US have more saturated fats and carbohydrates. This round goes to France!

Comments at the finish line

The championship ended in a victory for France! US fought hard and won the fats and bread category, but still couldn’t beat France who won the meat, dairy and snack rounds.

So does this mean that France has better food than the US, and that this is the reason why the US is worse than France in all of the health statistics from WHO?

Unfortunately, no.

The reality is much more complex and by only studying 5 categories of packaged food one cannot cover its complexity. The categories were chosen rather arbitrarily, while a partitioning more suitable for a scoring system would probably require more categories along with a weighting scheme to make sure that the categories which has the most impact on health factors have more influence. It is easy to realize that developing this definition of categories would be a very complex task on its own, which could be an interesting angle for future work, to see how the results would differ.

The arbitrary point system aside, we have seen that to analyse differences between food items from different countries is not easy. When comparing food items, there are many factors to consider, so dividing the data set into categories helped us narrow down things a bit, to be able to draw conclusions regarding a subset of the data. Without this partitioning it would have been much harder to make sense of the data as it is not feasible to compare the nutrient content of totally different products, for example comparing bread items to dairy items.

Then does the questionable scoring system make the whole study useless?

NO!

Taking a step back from the separate categories helps us to draw some conclusions. In fact, what we have seen in general is that food items from the US have more sugar and carbohydrates while the food items from France have more fats. With the rather crude rule that sugar is worse than fat, we can conclude that our observations actually align with the health statistics in this aspect. If we were to try to order the categories in order of importance of risk of obesity, the snacks category might come on top, making France have a better result in the most important category.